

The Blog of
TEAM WORK EXCELLENCE
TEAM WORK EXCELLENCE
Skills, Tools, and More to Improve Leaders, Teams, and Cultures |
Skills, Tools, and More to Improve Leaders, Teams, and Cultures |
|
Over the years, there have been a few tools that I have worked with that have proved invaluable. I tend to go back to these "golden" tools again, and again, and again. When I share these tools with clients, they find them useful, and I look like a hero. This is one of those tools. The Periodic Table of Visualization Methods, designed by Ralph Lengler & Martin J. Eppler at the Institute of Corporate Communication, University of Lugano, Switzerland, classifies visualization methods so those trying to tell a story graphically choose a framework to display your data. 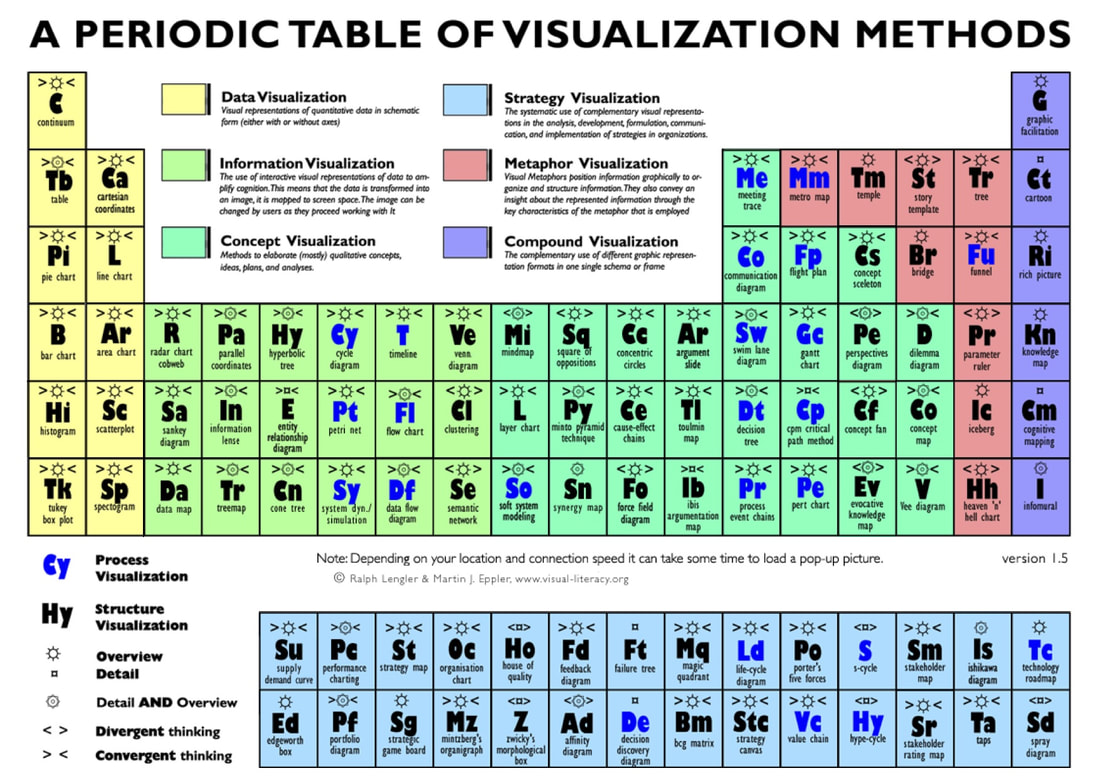 I am constantly surprised that despite being around for over ten years now, how many people have not heard of it. I shared it again this morning, and I figure it's high-time I do my part to spread the word. I have no affiliation with the Visual Literacy Project, but I am a fan. It has helped me professionally, I hope it helps you. The Periodic Table of Visualization helps you decide on an ideal graphic based on their subject, goal, and the needs of the audience:
Using the Periodic Table of Visualization Methods will not only stimulate ideas on how to best visualize the story you want to tell, but it helps you to pause and consider what you are trying to convey through the presentation. That will help you stay on message and build a common understanding with your audience.
Save this link to your favourites, and have fun using this tool over and over. Best, Tim
0 Comments
|
Videos, Articles, Tools and More for Leaders in BusinessSET UP FOR SUCCESS?
|

© TeamWorkExcellence 2023. All rights reserved.
|
 RSS Feed